
Looking Forward to Good Data
Before we can start looking forward, both in terms of making valuable predictions about the future and finally overcoming our F**ked data, we need to assess and build our foundations.
Steps 1–4 are all about looking back: we’re seeking to understand what has happened and what is happening. The stages build in complexity before reaching the most challenging and testing stage, Level 4 – The GAP. Crossing the GAP requires talking to other silos and getting other people onside and aligned with our vision, and to do that, we need the God-given mandate from senior leadership to do so. This is where we have to move past just relying on our CRM or GA and look to centralise the collection and distribution of data across many different tools and departments. Don’t fear. You should not tackle this all at once but start small. Let’s start looking forward to good reliable data.
Level One – Just Starting, or You Do Not Trust Your Data.
Only 54% of marketing decisions are being influenced by marketing analytics, according to Gartner’s latest Marketing Data and Analytics Survey 2020.
This is a worrying trend when respondents cite poor data quality, unactionable results, and nebulous recommendations as top reasons they don’t rely on analytics to make decisions.
Although we may have completed some of the tasks at other levels, by all likelihood, if you picked up this book, you’re starting somewhere around here. At some point, your organisation could have been flying at level 3 with the wind in its hair. Still, now you are sub-zero because some combination of mismanagement and misunderstanding has led your organisation’s analytics to fall off by the wayside, or perhaps some technological change has forced you back to the point of outdated and unreliable data.
When writing this book, a recent research piece said that ‘Google Analytics is used by 28.1 million websites, and approximately 55.49% of all websites use Google Analytics.’ Universal Analytics (3) was released in 2012, and since then, millions of us marketers have got used to its structure and interface. By July 1, 2023, all those users must have transitioned to the new and very different Google Analytics 4.
Huge, unwieldy legacy implementations used by multiple people and marketers and customised by numerous developers over many years will need to be quickly and correctly transitioned. On top of this, it will take time for us marketers and analysts to get our heads around this new tool. It’s a tremendous upheaval and, for many companies, a forced fall off and tumble down the Analytics Maturity Curve.
The marketers struggling most with these changes have no plan to work from or no records of how, why, and when something was implemented. To get from 0 to 1, we need a few things in place.
Initial Audits and Reconciliation
First, a tirade… Whatever you do, don’t tell me, ‘It’s working’. This is the worst thing you can say. If you hear anyone say it’s working, the hair on your neck should stand up, and you should come out with chills. When I hear the completely lacking nd sketchy words, I breathe and ask what exactly is working, by how much, and show me the proof. The further away from the data that the person you are working with is, the more you shouldn’t take this answer at face value and let your bullshit indicator start firing; often, it just means ‘I added the code following a blog, and I saw myself appear in real-time in the GA interface.’
A good structure for an audit is:
1. Code
2. Configuration
3. Data Integrity
Checking the code is simple and most often completed correctly. You can also do this yourself to some level, and I recommend having a debugger like Google Debugger on your browser if you’re using GA.
As for configuration, they or you should be asking questions about how you would like your analytics configurated. Some settings have increasingly important legal ramifications and must be checked with you first, or is your agency or web company blindly ticking ‘OK’ without reviewing your data policy? Probably at this point, you may be thinking ‘Oh shit, do we need a data policy?’ Unfortunately, yes, but even something simple could do for now.
Source: McKtui Consulting
Data Collection Legal Considerations
Again, using GA as an example and with my disclaimer here.
-----------------------
The following does not constitute legal advice. During the setup, there are several terms and conditions that Google will ask the implementer to agree to on your behalf – depending on the functionality of the setup; these are as follows:
Google Ads Data Processing Terms* –
· https://business.safety.google/adsprocessorterms/
· Google Analytics Terms of Service Agreement –https://marketingplatform.google.com/about/analytics/terms/us/
· Google Measurement Controller-Controller Data Protection Terms –https://support.google.com/analytics/answer/9024351?hl=en
Here is the data typically collected by GA4:
The following link has the key ‘Dimensions and Metrics’ listed as part of the installation:
-----------------------
Google generally strives to ensure that personally identifiable information (PII) is not collected, but the definition of what constitutes PII changes market-to-market. Occasionally PII can be collected accidentally in URLs.
Finally, they are either auditing your existing implementation or completing a new implementation. In the latter case, you should expect some communication around benchmark numbers to confirm if your setup is genuinely working. Some larger organisations perform a regression test on larger setups to see if there is a significant tracking difference in large transitions from one tool to another or some other data source. However, even for small setups, it makes sense just eyeballing and screenshotting critical metrics over time. This is really important and often missed.
Universal Analytics or GA3 often had issues with Bounce Rate, and this regularly pointed to a more significant problem. One of those issues could be double code. If your team had not caught the common issue of adding code twice, you could often catch the issue in a Data Integrity Check, where we could check the ‘continuity’ of key metrics either 3 days, 1 week, 1 month, or even 12 months after implementation.

Source: https://optinmonster.com/
In this case, the Bounce Rate drops to effectively zero because a hit is counted twice in quick succession, so actually, the User in Session cannot bounce away from the page because the second false hit is taken as some kind of interaction that did not happen. The chart above shows how the situation can be murky as this double code may only be on some sections of the website, making the drop look more normal as it’s averaged across the simultaneously ‘working’ and ‘not working’ tracking.
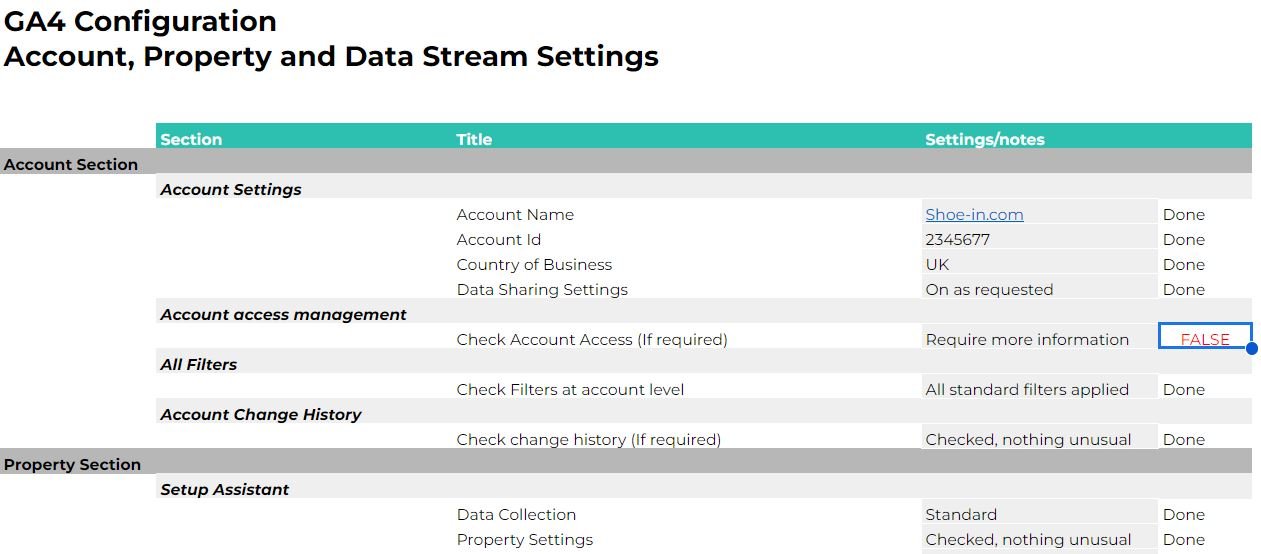
Another important step is creating and maintaining a measurement plan (Chapter 4 Plan, Plan, Plan). If you want good data, you must have a measurement plan freely shared and understood throughout your organisation. Typically, the best tool for this is a shareable spreadsheet using SharePoint or Google Sheets. This is so important that we devote an entire chapter to it later in the book.
Your initial setup should begin modestly: start with the must-haves and build as your skills, requirements, and resources do, but everything on your app or web page that you are looking to track now and in the future should be entered into your measurement plan.
Once we have completed a basic setup, tested our setup, and been careful to follow our measurement plan, we can move on to using our data to inform decisions, and because we’ve been involved in or led the initial steps, we can trust that our foundation web analytics data is correct. We’ve got a good idea of what we’re tracking and why, so we can start pulling this data into dashboards and reports depending on whom the audience is, which will determine what data we pull.
After this chapter, you should understand the Analytics Maturity Curve and its different levels. You will know where you are on the curve and where you want to be.
You will be familiar with structured approaches to auditing tools like Google Analytics, looking at Code, Configuration, and Data Integrity. You will start to consider your own data policy and what a disclaimer could look like.
We’re ready to look at the rest of the Analytics Maturity Curve in more detail, starting with Section 2.1 – Levelling-Up.
This blog post is a snippet of a much bigger text - Your Data Is F**KED for Marketers - You can purchase this book here in print or Kindle or join the newsletter below to wait for the next free blog snippet or even the next free book release.